Buchans
-
In December 2023 Canterra Minerals acquired the Buchans Project from Buchans Minerals Resources (see news release dated December 20, 2023). The Buchans Project is host to the NI 43-101 compliant resource for the Lundberg Deposit (Table 1.). ASARCO mined approximately 16.1 million tonnes of ore averaging 14.5% Zn, 7.6% Pb, 1.3% Cu, 126 g/t Ag & 1.37 g/t Au from the Buchans deposits from 1935-1981.
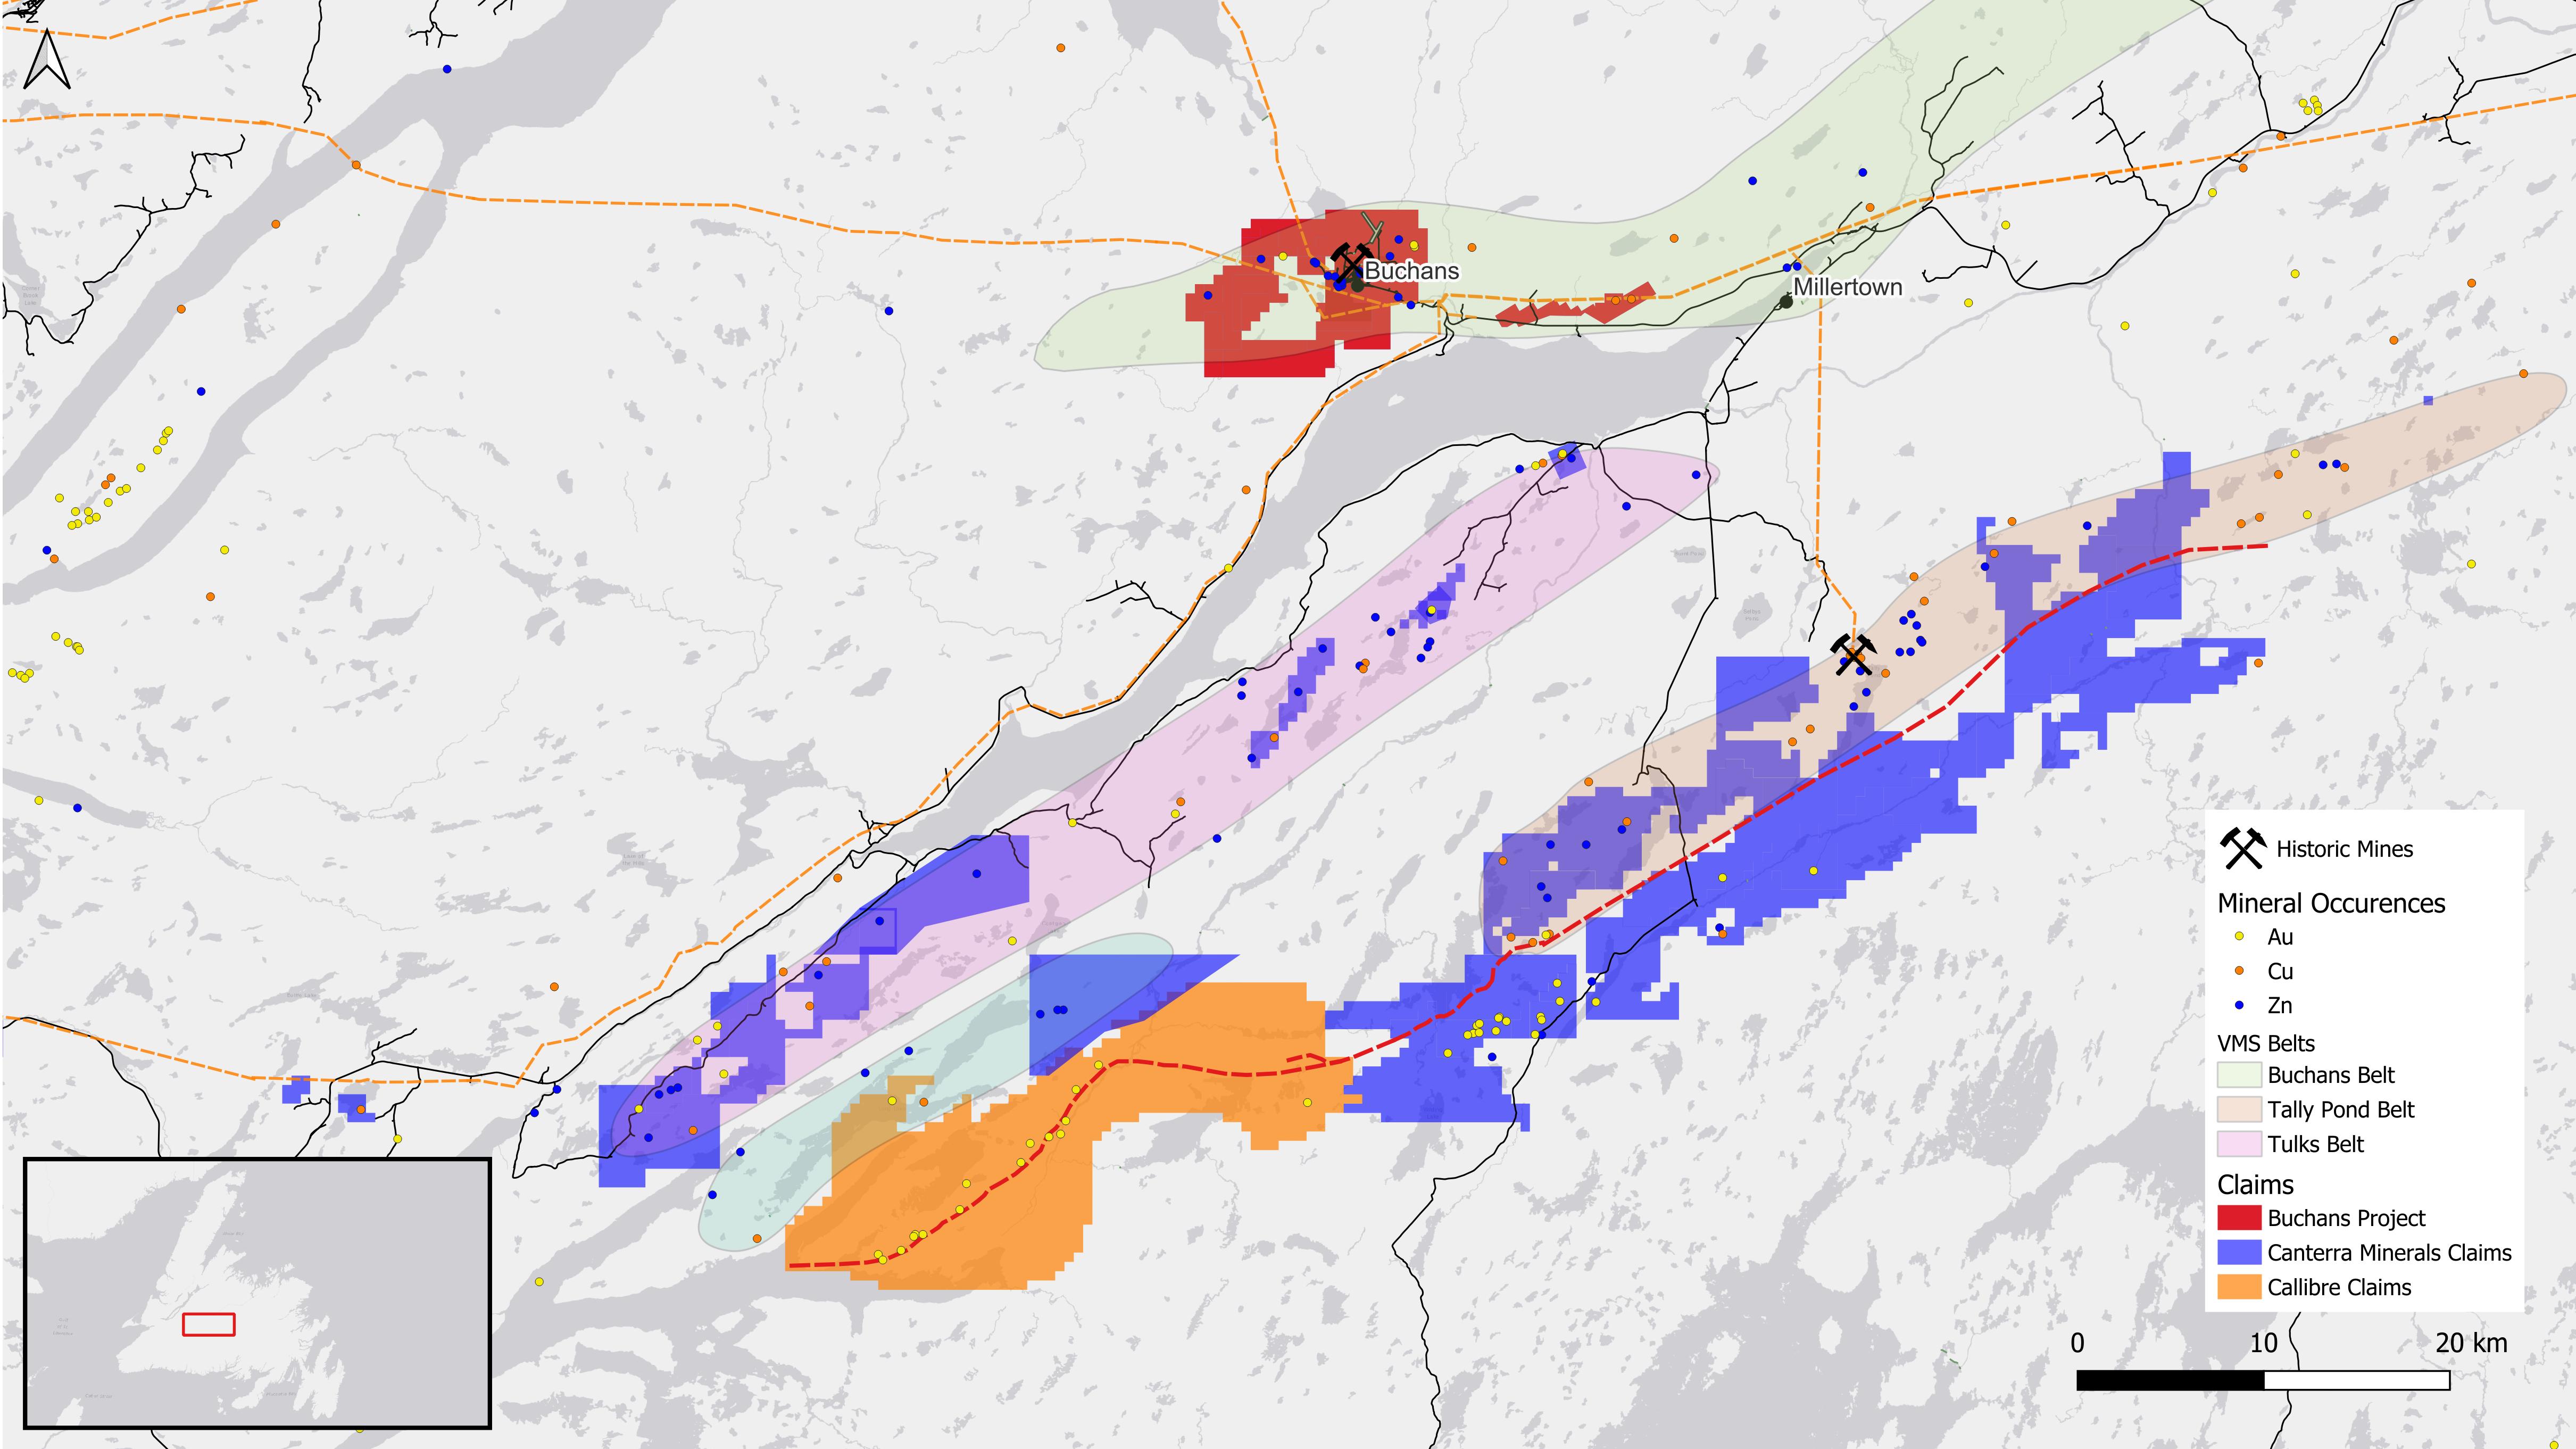
Figure 1. Central Newfoundland claims held by Canterra
Deposit
Category
Tonnes
Zn (%)
Cu (%)
Pb (%)
Au (g/t)
Ag (g/t)
Lundberg1
Indicated
16,790,000
1.5
0.4
0.6
0.07
5.7
Inferred
380,000
2.0
0.4
1.0
0.31
22.4
Table 1. Lundberg Deposit Resource
1. Lundberg Mineral Resource Estimate is based on $20 US/t NSR cutoff grade as reported in the Technical Report entitled Technical Report entitled “NI 43-101 Technical Report and Mineral Resource Estimate on the Lundberg Deposit, Buchans Area, Newfoundland and Labrador, Canada” prepared for Buchans Minerals Corporation. Report date April 15, 2019 (Effective date February 28, 2019). Prepared by: Michael Cullen P.Geo., Matthew Harrington, P.Geo., and Shaun O’Connor, P.Geo. (Mercator Geological Services). Resource figures have been rounded to reflect the relative accuracy of the estimates. Mineral resources are not mineral reserves and do not have demonstrated economic viability. Canterra is not treating the Lundberg Mineral Resource Estimate as a current resource estimate, but rather as an historical resource estimate as neither Canterra nor the QP has verified the associated mineral resource estimate as current mineral resources or mineral reserves.
The Buchans Mine Property lies on the north side of Beothuk Lake 35 kilometres from Teck Resources’ past producing Duck Pond Mine and Canterra’s Lemarchant VMS deposit. This project has benefited from substantial relogging and digitization of more than 70 years of historic data and hundreds of thousands of metres of core relogging. In addition, a recent collaboration agreement with Boliden AB, a global mining company, utilized 3D modelling of this data and reprocessing the vast existing geophysical database. This data identified several drill targets for new high-grade massive sulfide deposits outside of the existing resource base. No drilling has yet been done to test these compelling new targets.
2018 exploration drilling at the underexplored Two-Level target intersected significant results in drillhole H-18-3524:
- 1.8 m of 5.57% Zn, 0.76% Cu, 3.15% Pb, 90.5 g/t Ag & 0.37 g/t Au
- incl. 1.0 m of 8.70% Zn, 1.26% Cu, 4.87% Pb, 133.2 g/t Ag & 0.47 g/t Au
The success of drilling at Two-Level target confirms recent modelling and demonstrates the potential to discover both new high-grade in situ VMS mineralization and transported VMS mineralization that comprised 52% of the mining that had been done historically. The Two-Level mineralization also represents an opportunity to add higher grade resources allowing for expansion of the adjacent Lundberg deposit.
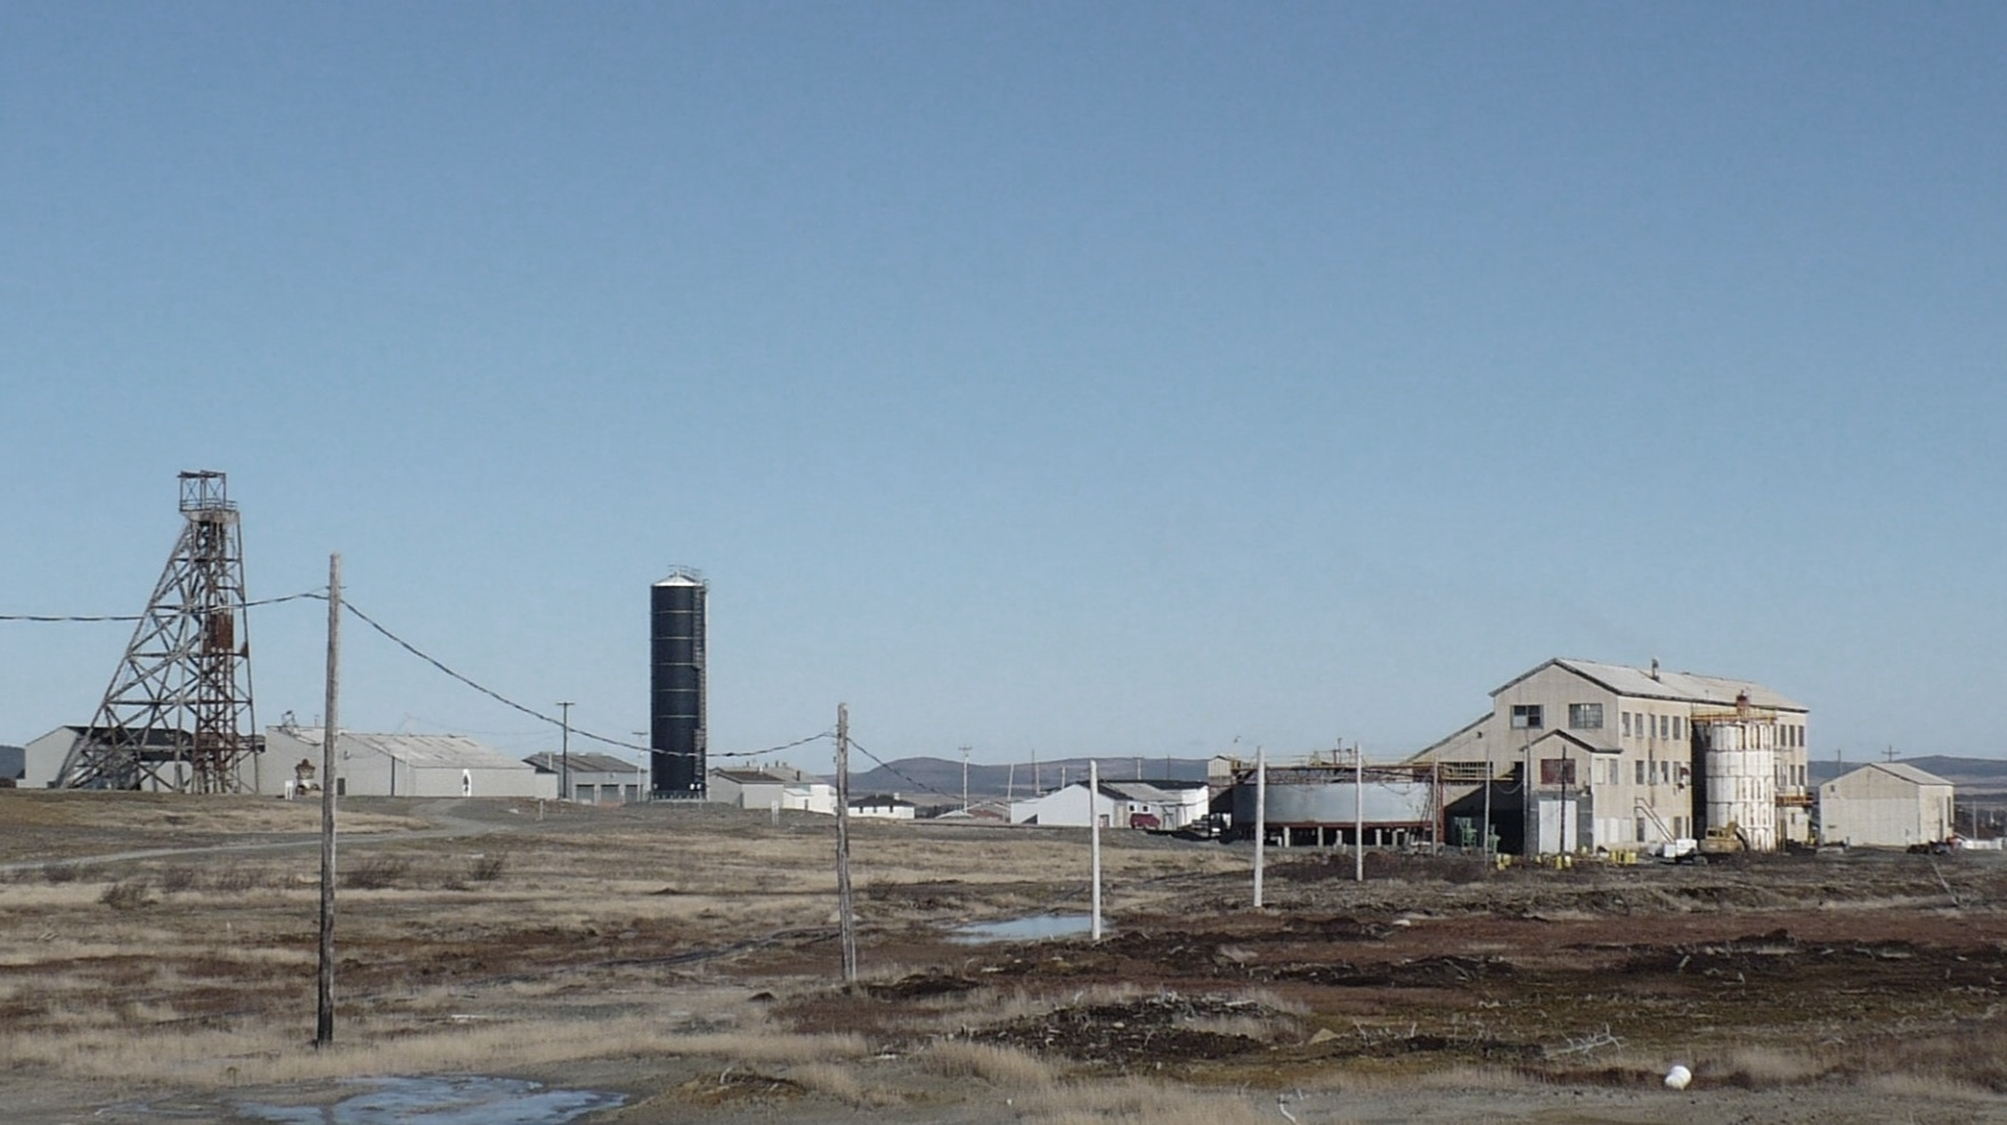
Figure 2. Historic Buchans Mine area with headframe and infrastructure shown
- 1.8 m of 5.57% Zn, 0.76% Cu, 3.15% Pb, 90.5 g/t Ag & 0.37 g/t Au